Top 10 Infrastructure Monitoring Tools
Introduction:
Servers and Network monitoring systems in any environment Linux or windows is utterly important to keep your infrastructure and running smoothly. Below monitoring tools help you to monitor all kinds of system resources including the CPU load, Memory Usage, network traffic, status of all devices connected to the network or in providing instant notifications to the admin when it detects any abnormal or suspicious activity.
There are many popular monitoring tools available in the market and we’ve analyzed the top 10 open source Linux monitoring tools.
1) Nagios Core
- Nagios is one the most widely used network and server monitoring systems that has been in the industry for almost 18 years.
- With all the experience in understanding all kinds of network issues, Nagios Core has been developed into a powerful monitoring system that allows the organizations to keep their network intact as Nagios Core helps to identify and resolve all kinds of issues before becoming a huge critical issue.

- It is basically a text based configuration tool as all kinds of configuration are stored in text files and it takes some time to learn about the functionalities and configuration options of the software, but once you’ve mastered it, you don’t need to worry about any problems with your network.
Pros:
- It use of SNMP Protocol is easy, transparent and almost effortless
- The event handler has proved to be an extraordinary tool
- It is able to work with other tools such as rrdt for graphics and nagvis for maps
Cons:
- Configuration
- User interface
- Native applications for Graphics
2) Zabbix
- Zabbix is another free monitoring tool that is written in PHP and is licensed under GPL. Zabbix is a combination of both Nagios and Cacti and provides a simple way for monitoring your network and provides timely alerts.

Some of the unique features of Zabbix includes:
- It is completely open source and can be used for both non-commercial and commercial use for free
- Admins can easily monitor their servers and networks easily with the help of statistics.
- Admins can also monitor all kinds of network devices and applications.
- Notifications are sent through SMS and email during any suspicious activity
- Designed for use in both small scale and large scale applications
Pros:
- History graphs show long-term trends, but still allow you to dig down to the minute.
- Custom dashboards allow for teams to only monitor what’s relevant for them.
- Generate reports on the performance of network assets.
Cons:
- Setting up items, triggers, hosts, classes, etc. is first tedious, secondly not very obvious.
- Auto-discovery can get difficult if you don’t have the correct configuration bits.
- Overall the UI is functional, but not necessarily pretty.
- Leave the operation a little lighter.
3) Cacti

- Cacti is not your regular network monitoring tool, but a great data collection tool that helps in gathering all kinds of data regarding user permissions, user access to certain charts and also helps in building complex graphs and storing data securely in a MySQL database.
- All the data gathering job is done through a cron job by an external script that provides all the metrics to build the graphs.
- Cacti can be used to build all kinds of graphs, which can be displayed and organized in a lot of ways.
Pros:
- It can measure availability, CPU load, drive capacity, errors and more.
- It reacts to conditions and sends notifications, if the conditions are not within a specified range.
- It helps to make the most of rrdgraph to automate their display
- Easy to organize information in a hierarchical structure.
Cons:
- It is hard to fix configuration errors.
- Cacti configuration should be up-to-date always. It is best you use scripts for this purpose.
- Plugin Architecture versions are hard to install with Its packages
4) Icinga

- Icinga is another great monitoring system for your linux environment that helps you to monitor all your network devices and all the resources connected to its network.
- Icinga also instantly notifies the admin when there are any suspicious activities happening in the network.
- This is an enterprise grade tool that can be used for server and monitoring systems across large network environments and offices situated across various locations.
Pros:
- Wealth of community-developed plugins.
- Stable codebase.
- Icinga 2 supports distributed monitoring.
- Very performant, can support tens of thousands of checks per server.
Cons:
- Difficult, arcane configuration.
- It is very difficult to integrate into modern configuration management systems.
- Hard to fit concepts like auto-scaling groups of ephemeral servers into the Icinga’s aging conception.
5) Zenoss Core
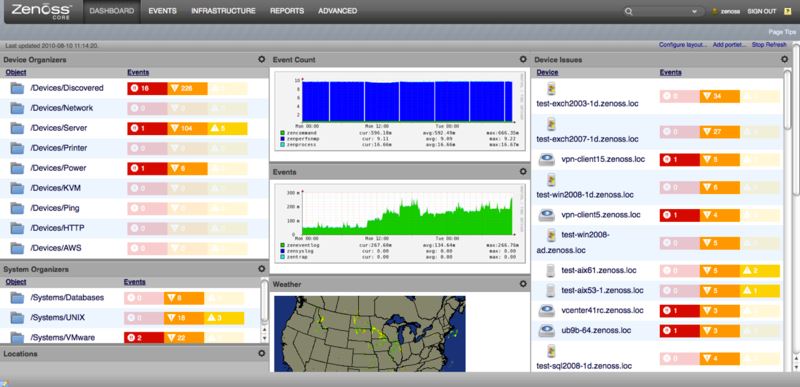
- Zenoss Core is another excellent network monitoring tool that is specially designed to be used in enterprise networks.
- It is a great software that comes loaded with a lot of features that you can find commercial monitoring tools.
- It is definitely a boon to any network administrator who needs a unique solution to monitor and address all their network issues easily.
Pros:
- Multi-platform support across a wide range of hardware and software infrastructure and it is truly a vendor-agnostic platform.
- Vendor-specific feature/configuration support, via ZenPacks, providing much better end-to-end visibility as compared to most legacy monitoring platforms — especially for devices such as firewalls, middleware gateways, and load balancers.
- Zenoss Cloud should prove to be more scalable and easier to upgrade than legacy platforms such as SolarWinds, IBM, BMC and more
Cons:
- It supports streaming data that is on the roadmap must currently be addressed via a third-party app.
- For some customers, a cloud model may be a better fit than a pure cloud model.
- The onsite collectors offer some, but not all, of this functionality.
- Tighter integration with third-party AppDynamics and/or built-in app performance tools.
6) OpenNMS

- OpenNMS is another excellent network monitoring tool that is completely open source.
- It is also known to be the first enterprise level monitoring system released to be used in many large corporate companies with a huge number of devices connected to its network.
- Users can automatically detect the nodes or monitor all kinds of services in the network with the help of OpenNMS.
Pros:
- Collecting information from various vendors and platforms.
- Displaying the information that’s collected in an easily readable format.
- Notifying us of problems as soon as they arrive so that we can address them as quickly as possible.
Cons:
- We’ve had a few issues with delayed alerting.
- I haven’t quite figured out how to make topologies work yet, but I haven’t spent a ton of time on it either.
- We have also had a bit of trouble importing some MIBs, but that usually boiled down to working with the vendor to make sure that we had the right MIBs and dependencies.
7) Centreon
Centreon also known as Centreon Enterprise server (CES) is another exceptional network monitoring system, it is used in many large banks, IT companies, major insurance and finance companies around the world to monitor the activities of their users and also to monitor the status and health of their network at all times. With CES in place in your company, you can be relaxed and sit comfortably supervising all your infrastructure and applications attached to the information system

Centreon comes loaded with a lot of feature and also provides a lot of advantages including:
- It is a real-time management console and operating system
- With the help of the publisher solution provided in the software, you can maintain the whole platform easily without any issues
- We can add number of users to the monitoring system through open software mechanisms
Pros:
- Great filtering capability in GUI interface
- Proactive end to end monitoring
- We can easily make changes on a single dashboard with minimum time
- Easily Configurable and simple to handle Review collected by and hosted on G2.com.
Cons:
- For enterprise solutions Centreon is quite expensive.
- Need to improve the GUI interface more.
- After refreshing these tools it will take time for data loading.
8) Observium

- Observium is another great network monitoring tool that is written in PHP/ MySQL/ SNMP
- It is developed as an auto discovering tool to find out all problems in the network and notify them immediately.
- It is also developed to support various operating systems including Linux, Cisco, Juniper, HP, and Foundry etc. It comes loaded with an extremely easy to interface that provides all historical data about all the devices connected to the network.
Pros:
- You can see the bits per second that are happening on the ports, which is fantastic.
- Between logical interfaces, you can see how much bandwidth is being used per second or /minute or /hour.
- You can infer power consumption and conflicting routes.
Cons:
- The UI is pretty robust and succinct. It is beneficial to have favorites for complex network schemas.
- Historical searching based on X time frame.
- More customized dashboards.
9) MRTG

- MRTG means Multi Router Traffic Grapher and it is another simple network monitoring system like Nagios, Cacti and Zabbix.
- It is specially designed to be used in networks with a smaller number of computers.
- It is also mainly used for all devices like CPU, memory and other interfaces connected to the network.
- It also helps in providing detailed network statistics.
Pros:
- MRTG can be installed and set up very easily.
- It works on most of the Microsoft Windows environment and UNIX platforms.
- It employs Standard Simple Network Management Protocol (SNMP) and Management Information Base (MIB) to collect data.
- MRTG makes use of Perl for scripting and easy customization.
- It generates HTML pages that assist in displaying easy and clear graphical results. The graphical reports facilitate analysis of trends for network traffic.
- This monitoring tool can be used for checking numerous devices and interfaces.
Cons:
- In MRTG each graph only has two counter types and can be monitored, in general incoming and outgoing counters.
- The graphical functionality of RRDtool is in this expect more extended.
- Network Latency Detection & Monitoring
10) WhatsUp Gold
WhatsUp Gold by ipswitch is a paid monitoring program with available free trials that automatically migrates from its previous version (v16.5) and adds new functionality, like virtual monitoring at-a-glance.
- Programmable for IFTTT, allowing you to program automatically triggered actions when WhatsUp detects problems
- Integrates with Slack for ease of communication between developers
- Highly customizable dashboards and maps let you set up your dashboard how you like it

Pros:
- The user experience with the new interface.
- The ease of setting up active monitoring. Network Discovery.
- Performance monitor and traffic monitoring.
Cons:
- Sometimes it cannot seem to handle the load of many devices on one server.
- Could use more user support communities.
- Logging and reporting could be better.

Top 10 Programming Languages To Learn in 2020

Top 10 Version Control Systems